Jump to content
Twins Daily
  • Create Account
  • Twins Tidbit: Where are the Missing Runs?


    TwinsData

    The Twins are 5th in baseball in team OPS but only 13th in runs scored per game. An additional 0.19 runs per game would move them to 5th in run scored per game, suggesting there are 18 missing runs. Where are they and why are they missing?

    Image courtesy of TwinsData

    Twins Video


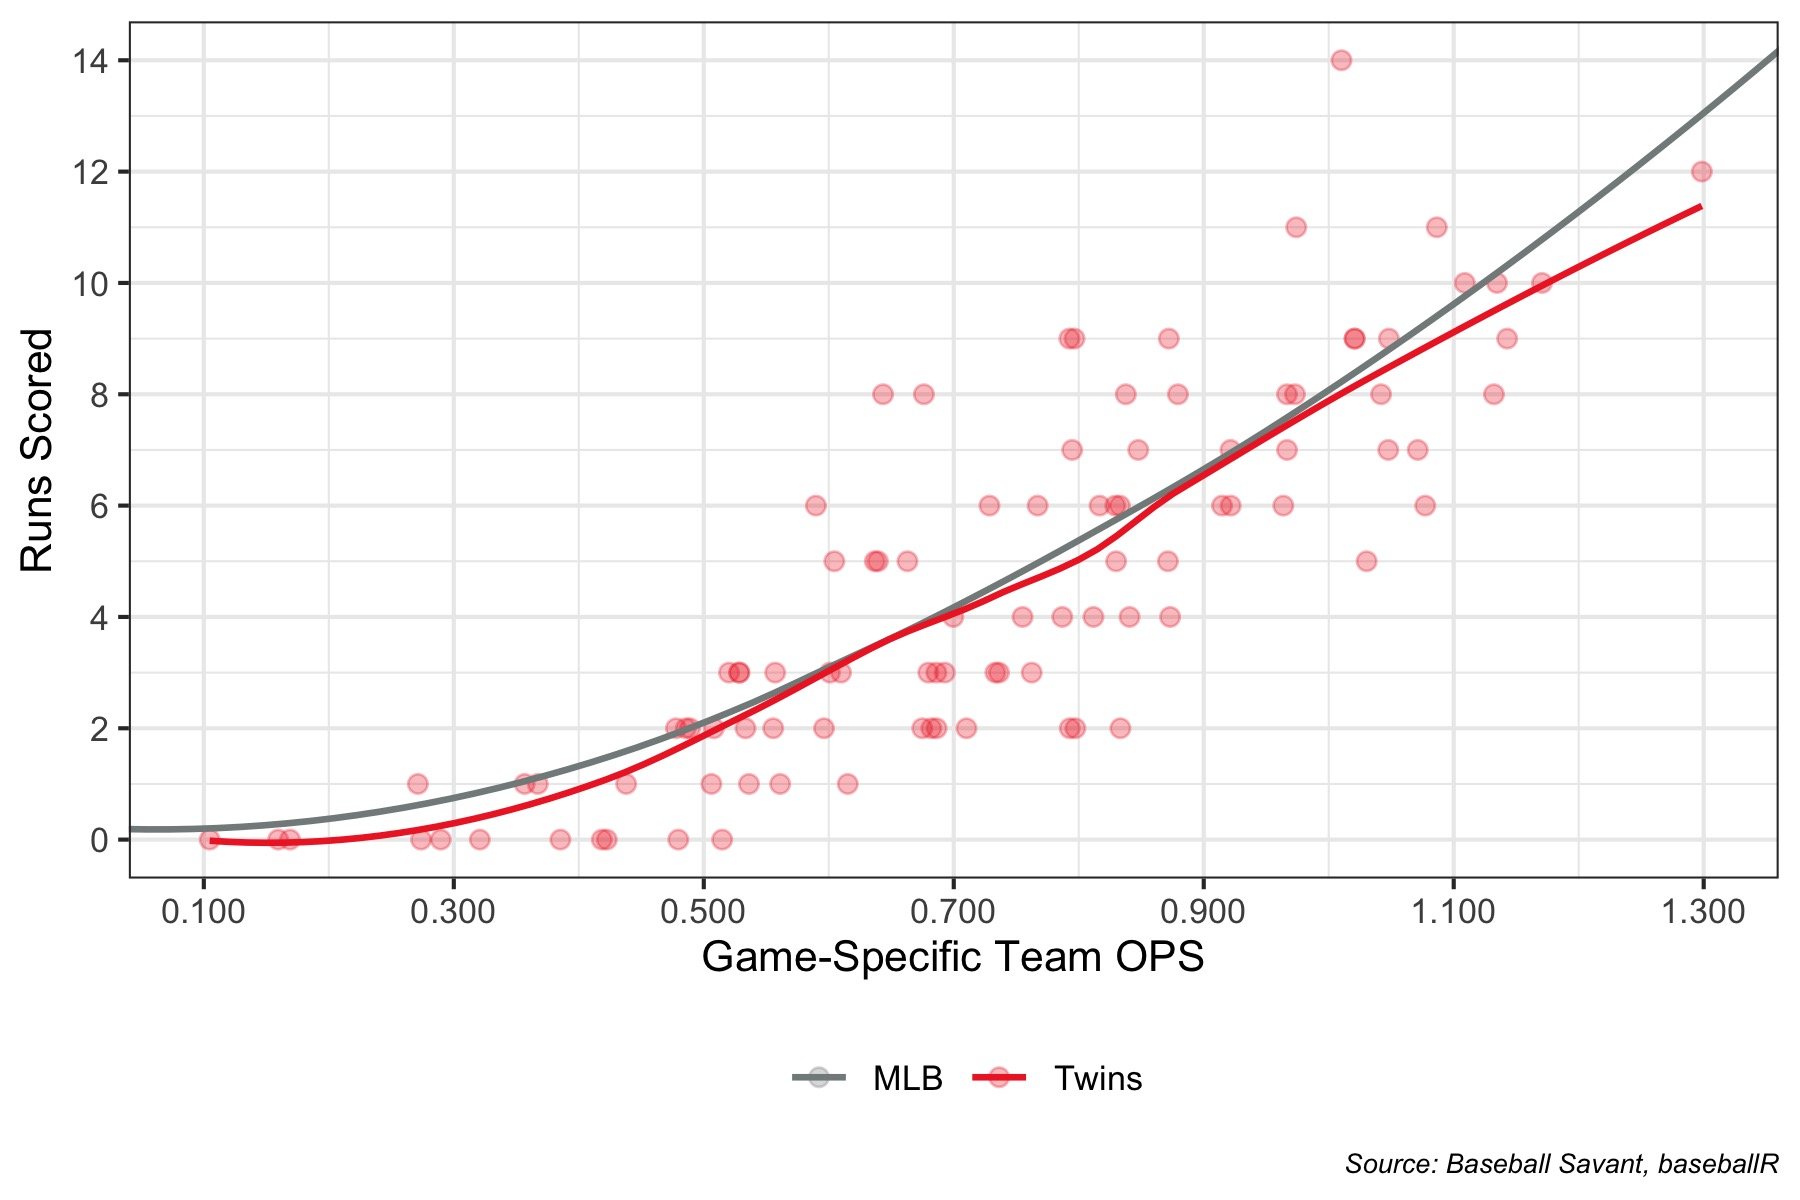
    The above graph shows, for each Twins game this season, their game-specific team OPS and the runs scored in red. The solid red line is a moving average specific to the Twins. It measures how many runs the Twins typically score in a game given the OPS on the x axis. The solid gray line is the rest of the MLB.

    You can interpret these lines as "how each group turns OPS into runs". For example, when the Twins have an OPS around 0.600, they typically score 3 runs. Ditto for the rest of the MLB. The more interesting story appears where the lines diverge. Where the Twins line is lower than the MLB line, there are missing runs.

    The left side of the graph shows missing runs in games where the Twins bats go cold. The Twins have had 17 games with an OPS of less than 0.500. Typically, teams find a way to scratch across 1 or 2 runs when this happens. The Twins, however, have been more frequently shut out on these occasions.

    The right side of the graph has missing runs as well. The Twins have had 6 games with an OPS of more than 1.100 and only once scored more runs than expected in these games. For example, the Twins had a 1.132 OPS against Michael Kopech and the White Sox on July 5th but only scored 8 runs. A typical team scores 10 runs with that kind of production. There are two missing runs. (Rest easy, the Twins won 8 to 2.)

    Why the Twins don't turn OPS into runs is still up for debate. But it's clear that it happens at both ends of the spectrum: in the games where the lineup struggles and in games where it mashes.


    MORE FROM TWINS DAILY
    — Latest Twins coverage from our writers
    — Recent Twins discussion in our forums
    — Follow Twins Daily via Twitter, Facebook or email
    — Become a Twins Daily Caretaker

     Share

     Share


    User Feedback

    Recommended Comments

    Featured Comments

    4 minutes ago, Craig Arko said:

    The only possible causal connection I can see is the baserunning one. Otherwise it’s probably dumb bad luck.

    Agreed. Standard errors would shed some light on that, though only in a probabilistic sense. 

    Link to comment
    Share on other sites

    28 minutes ago, big dog said:

    Agreed. Standard errors would shed some light on that, though only in a probabilistic sense. 

    Great questions about statistical significance.

    Significance testing would go something like this. Suppose the Twins converted OPS to runs just like every other team (the gray line). How unlikely is it to produce the patterns given in red in the 96-game sample? And the statistical answer will be that it's not too unlikely. 96 games just isn't enough to separate signal from noise. 162 probably would not be either, so if statistical testing is the bar to clear to identify teams doing a bad job turning OPS into runs, we'll simply never identify one even if they exist.

    Link to comment
    Share on other sites

    2 hours ago, Craig Arko said:

    The only possible causal connection I can see is the baserunning one. Otherwise it’s probably dumb bad luck.

    There is another possible factor, although the I don't know what the underlying numbers.  OPS is just adding two stats together and is a good shorthand for calculating offensive value, but I don't think it's precise enough for what we are trying to figure out.  

    I have heard that OPS undervalues OBP and overvalues SLG. 

    Is the team OPS heavy on the SLG and light on the OBP? I don't know the answer, but that might be one place to look.


    Link to comment
    Share on other sites

    Comparing team situational splits to the full MLB, it looks like they do relatively worse with 2 outs, regardless of the on-base situation.  Been kind of a 3 year trend.  The 2019 Bomba Squad didn't really show a similar dropoff.

    https://www.baseball-reference.com/teams/split.cgi?t=b&team=MIN&year=2022#all_outs

    https://www.baseball-reference.com/leagues/split.cgi?t=b&lg=MLB&year=2022#all_outs

    Link to comment
    Share on other sites

    Just looked at the numbers as of today. The Twins are now 11th in Runs per Game, so a couple of teams just above them must have had low scores last night. It is an extremely small gap among a large number of teams. They are currently at 4.563. Moving to fifth would now require 4.688, which would be another 12 runs, or 0.125 runs per game. That's an extremely tiny number to try and attribute to one or two specific reasons, given everything that factors into turning OPS into runs.

    I didn't do an innings adjustment, The Twins have played fewer extra inning games, so have fewer innings (they have 7 extras, league average is 8.5), but the ghost runners increase the number of runs scored per inning, so that's probably a net disadvantage for their stat.

    Does 12 more runs over 96 games matter? Mostly in one-run games, unless you have one of those games where Mickey Hatcher gets thrown out on the bases 3 times (that happened, right?). The Twins are 15-13 in one-run games, a .536 winning percentage that is just barely below their season winning percentage. It is better than some of the teams fighting for playoff spots (Tampa Bay, Boston, Philadelphia, St Louis, LA Dodgers, and SF Giants) and worse than the others, most of whom (other than Cleveland and Chicago) have better overall winning percentages than the Twins.

    I guess my takeaway, and yours could be completely different, from this statistical wool-gathering is that

    - it is unlikely anyone can find a particular reason to explain the run shortfall, at least any better than the vagaries of probability suggest; and

    - if you could find it, and you could fix it, getting another 0.125 runs per game isn't likely to add any wins, unless you could get them all in the bottom of the ninth and come from behind. Which I encourage this team to do, wholeheartedly.

    I also encourage Miguel Sano to grab the DH slot and catch fire. That could help a lot.

    Thanks for raising the question, TwinsData, I've enjoyed thinking about it.


    Link to comment
    Share on other sites

    1 hour ago, big dog said:

    - if you could find it, and you could fix it, getting another 0.125 runs per game isn't likely to add any wins,

    You might be surprised.  The rule of thumb, given modern run-scoring numbers, is that scoring 10 additional runs during a season, or equivalently saving 10 runs on defense, adds about 1 win.  As you note, those runs aren't all going to occur just when you need them, thus the high ratio of extra runs to winning outcomes.

    The OP spoke of 18 missing runs, so that could be good for a couple of extra wins so far this season, in that light.


    Link to comment
    Share on other sites

    31 minutes ago, ashbury said:

    You might be surprised.  The rule of thumb, given modern run-scoring numbers, is that scoring 10 additional runs during a season, or equivalently saving 10 runs on defense, adds about 1 win.  As you note, those runs aren't all going to occur just when you need them, thus the high ratio of extra runs to winning outcomes.

    The OP spoke of 18 missing runs, so that could be good for a couple of extra wins so far this season, in that light.


    10 runs for one win- I could see that, averaging over a whole bunch of games and teams. It would be interesting to note what that statistic does and doesn't control for, too. I assume that is for a team with an average pitching staff? I wonder if team ERA is used when people estimate number of wins from runs.

    I was using my numbers from today, which says 12 missing runs (just because the rank for runs moves around a bit depending on how much other teams scored since it is so similar, and over 96 games a little counts for a lot). If I take that statistic and move forward, we have 66 games left, so at the same pace it equals 8.25 runs over the rest of the season. If we use the figure of 18 runs, then it is a healthier 12.375 additional runs. So I might be surprised, but I'm guessing the statistical variation in this is pretty huge so I still doubt there is anything here that isn't swamped by luck. One win by getting 10 more runs, two wins by having a ball hit an outfielder's glove in play and bounce over the fence and a run scoring on a bad call when the other team had used its challenge up. I will take any and all wins, whatever the source.

    Link to comment
    Share on other sites


    Join the conversation

    You can post now and register later. If you have an account, sign in now to post with your account.
    Note: Your post will require moderator approval before it will be visible.

    Guest
    Add a comment...

    ×   Pasted as rich text.   Paste as plain text instead

      Only 75 emoji are allowed.

    ×   Your link has been automatically embedded.   Display as a link instead

    ×   Your previous content has been restored.   Clear editor

    ×   You cannot paste images directly. Upload or insert images from URL.

    Loading...

×
×
  • Create New...