Jump to content
Twins Daily
  • Create Account
  • Twins Tidbit: Offensive Stock Report


    TwinsData

    As we move in August, which Twins hitters are heating up and solidifying their place in the every day lineup? Which are cooling off and casting doubt as to their role going forward? Let's take a look at the trends to determine which stocks to buy and which to sell.

    Image courtesy of TwinsData

    Twins Video


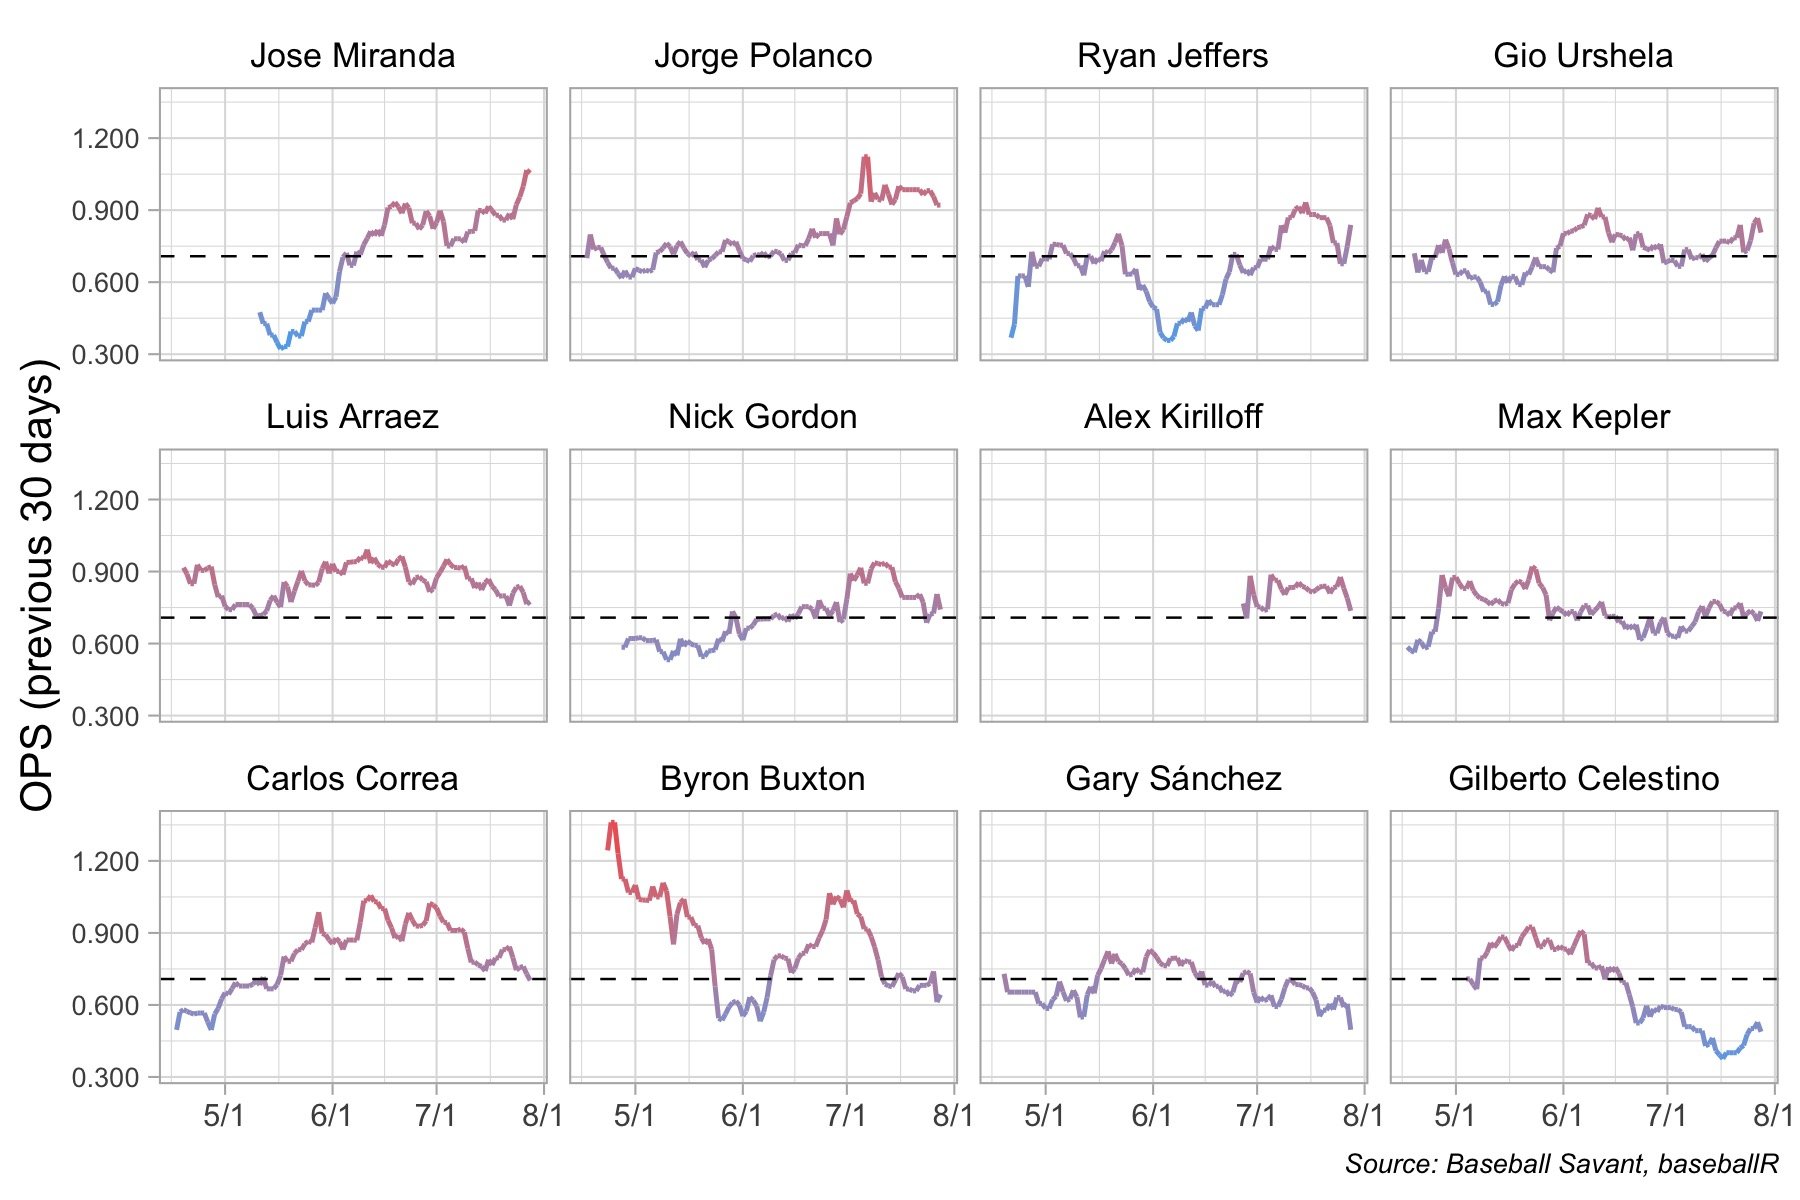
    The above graph shows rolling OPS (on-base plus slugging percentage) over the past 30 days for each hitter with a sufficient number of plate appearances in the last month.  For example, the height of the line at 7/1 indicates the hitter's OPS in the month of June. Hitters are sorted by their current OPS in the last month from left to right and then top to bottom. The dashed line indicates the MLB-average OPS of 0.708.

    Some takeaways:

    • Jose Miranda is the hottest hitter in the Twins lineup with a 1.054 OPS in the last 30 days, capping off a meteoric rise. On May 15, his rolling OPS was a paltry 0.322. Stock way up.
    • Jorge Polanco is similarly on fire. His rolling OPS has been above 0.900 for almost the entire month of July.
    • Ryan Jeffers' injury is a shame. He had really started to heat up. At the same time, Gary Sánchez has been in a steady decline since June began.
    • The consistent performance of Luis Arraez is remarkable. He has yet to have a 30-day stretch with a below-average OPS. By contrast, Byron Buxton is the most volatile hitter in the lineup with 30-day stretches of both 1.360 and 0.532 OPS.
    • An underreported part of the Twins' forgettable July has been the cooling of Buxton (0.643 OPS in the last 30 days) and Carlos Correa (0.702). Miranda and Polanco were a band-aid over a struggling top of the lineup.
    • It was past time for Gilberto Celestino to return to Triple-A. He owns a 0.488 OPS in the last 30 days and had been trending in that direction for some time.

    What else can we take away from the hitting trends that might help the Twins construct a winning lineup down the stretch?


    MORE FROM TWINS DAILY
    — Latest Twins coverage from our writers
    — Recent Twins discussion in our forums
    — Follow Twins Daily via Twitter, Facebook or email
    — Become a Twins Daily Caretaker

     Share


    User Feedback

    Recommended Comments

    Featured Comments

    From someone who went all rant on your last piece, I really liked this. Good data, and effectively presented (reinforcing some general impressions I had, but the Jeffers graph in particular caught my attention. Longer upswing than I was giving him credit for.

    Link to comment
    Share on other sites

    Okay, quick question, what does the horizontal dotted line represent?  I assumed it was league average OPS.  But Alex Kirilloff's OPS for 2022 currently stands at .669 which translates to a below average OPS+ of 92, while in his graph above, he is above the dotted line for every segment of this season.  It also looks like his clock started in late June, in that graph, but his overall season numbers have been dragged down by his abbreviated April/May.

    Link to comment
    Share on other sites

    1 hour ago, ashbury said:

    Okay, quick question, what does the horizontal dotted line represent?  I assumed it was league average OPS.  But Alex Kirilloff's OPS for 2022 currently stands at .669 which translates to a below average OPS+ of 92, while in his graph above, he is above the dotted line for every segment of this season.  It also looks like his clock started in late June, in that graph, but his overall season numbers have been dragged down by his abbreviated April/May.

    Correct. The dashed line is league average OPS.

    Those periods are removed from the data for Kirilloff. He had 18 plate appearances in April, then was out for 3 weeks, then had 14 plate appearances in May, then was out for 5 weeks. To include periods like that in the graphs would be distracting and misleading both for sample size reasons and the fact that there is no continuous stretch of play to actually measure a trend.

    Link to comment
    Share on other sites

    What would help the offense be productive through the remainder of the schedule is to add some significant pitching and release the pressure of scoring 7-10+ runs every game. That said, the lineup just needs to eliminate all distractions and go pitch by pitch and wear down their opponents.

    Link to comment
    Share on other sites

    On 7/29/2022 at 4:18 PM, TwinsData said:

    Correct. The dashed line is league average OPS.

    Those periods are removed from the data for Kirilloff. He had 18 plate appearances in April, then was out for 3 weeks, then had 14 plate appearances in May, then was out for 5 weeks. To include periods like that in the graphs would be distracting and misleading both for sample size reasons and the fact that there is no continuous stretch of play to actually measure a trend.

    No disagreement really.  I expect that there are several in the TD readership who have had reason to think carefully about aspects of data visualization during their education or careers.  Some cleaning of data is often called for.

    I hope you'll still give some thought to the underlying issue I raised, though.  Kirilloff's season numbers show a slightly below average OPS, but his chart fails to give any indication of why that might be.  Even though the omitted data is a small sample, it was so poor that it accounts for the difference.  Maybe having the lower cutoff of the y-axis be .000 instead of something around .300 is all that's needed.  A thick line to represent sufficient amount of data for a trend line, a thinner line to represent less sufficiency.  Those kinds of tactics.

    Link to comment
    Share on other sites

    Hands down my favorite regular read (at least I hope it will become that) on Twins Daily, which is a huge compliment.

    Being a new way to look at data, I also want to make a suggestion. 

    Changing the league average OPS to a rolling average as well. The OPS being a flat bar, particularly in a season like 2022, can be deceiving. Having a rolling league average would show us individual trends vs league wide trends.

    Or put them both on the graph. Regardless, I'll be digging in every time you publish.

    Link to comment
    Share on other sites


    Join the conversation

    You can post now and register later. If you have an account, sign in now to post with your account.
    Note: Your post will require moderator approval before it will be visible.

    Guest
    Add a comment...

    ×   Pasted as rich text.   Paste as plain text instead

      Only 75 emoji are allowed.

    ×   Your link has been automatically embedded.   Display as a link instead

    ×   Your previous content has been restored.   Clear editor

    ×   You cannot paste images directly. Upload or insert images from URL.

    Loading...

×
×
  • Create New...