Twins Video
So, how does this lineup, with such little star power, lead Major League Baseball in so many important statistical categories like runs scored, home runs, batting average, slugging percentage, OPS, wOBA and wRC+? The answer to that is they can hit at every spot up and down the lineup. The table below shows the Twins OPS from every spot in the order so far in 2019, and how they rank in the MLB after play on Tuesday.
The first thing that sticks out to me in this chart is how much worse the Twins have been in the three spot in the order, relative to the rest of the order. A lot of this could be explained by all the games Cruz has missed this year, but now that Cruz is back and healthy, this number will be on the rise.
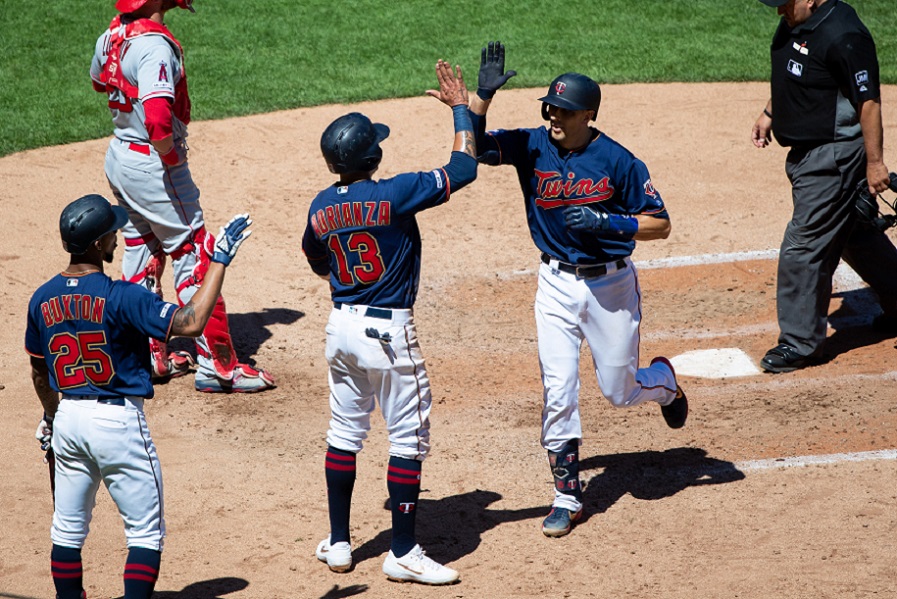
The other thing that strikes me is how well the Twins bottom of the lineup has been doing. I knew they were getting great production from guys like Jonathan Schoop, Jason Castro and Byron Buxton down there, but these numbers are off the charts for the bottom of the lineup. Overall, the bottom of the order (spots seven through nine) have an OPS of .868. The rest of the spots in the Twins lineup combine for an .851 OPS, which itself is the second-best lineup in baseball one through six.
To get a little better context on how well the Twins bottom of the lineup has been hitting I decided to compare their bottom of the lineup to how the bottom of the lineup has been performing for every other team in baseball this season. Unsurprisingly, the bottom of the Twins lineup had the best OPS in Major League Baseball. What is surprising is just how far ahead the Twins are above everyone else. The next closest teams are the Houston Astros and New York Yankees, who each have a bottom of the order OPS of .776. Overall, there are just four teams with an OPS above .750 from the bottom of their order, which is roughly the league average OPS.
With this big of a gap on everyone else, it got my curiosity going. How long has it been since an MLB team had an OPS above the .868 mark that the Twins have so far. I started by running a search query on the Fangraphs Splits Leaderboard. Unfortunately, their data for this category only goes back to the 2002 season, but since that time the next closest team to the 2019 Twins is the 2003 Boston Red Sox, who had an .838 OPS from the bottom of their order. After that, just two more teams had an OPS above .800, the 2017 Houston Astros and 2008 Texas Rangers, who both had an OPS of .802.
It was cool to see that over the past 18 seasons, no team’s bottom of the order was better than the Twins has been so far this year, and only one other team was even remotely close. However, I was not content, I still wanted to see when the last time a team had a better OPS from the bottom of the order than the 2019 Twins. Luckily, I knew just where I could find that answer, the Baseball-Reference Play Index.
Using the Play Index, I was able to view results dating back to 1908, and guess what, the 2019 Twins have the best OPS from any bottom of the order in MLB history. Another benefit of using the Play Index is it excluded plate appearances by pitchers, which would have skewed the results against National League teams along with all MLB teams prior to 1973. This also removes seven plate appearances made by Twins pitchers this year, and raises their bottom of the order OPS up to .875. After the Twins, the next closet team on the list is the 1930 St. Louis Cardinals, whose bottom of the order produced an .851 OPS. Overall, there have been just 22 teams with a bottom of the order OPS above .800, which is less than one percent of the time.
I also thought it would be fun to compare the bottom of the order of this year’s Twins team to those of Twins teams in years prior. The team that currently holds the Twins record is the 1963 Minnesota Twins, whose bottom of the order had an OPS of .777. After that, six of the next nine (including each of the next three) teams were the Twins teams from 1999 through 2004. All six of those teams had a bottom of the order OPS between .732 and .756. Now that is consistency. Additionally, both the 2017 and 2018 Twins teams did pretty well from the bottom of the order, as they had a .739 and .732 OPS respectively.
We still have a long way to go before the 2019 Minnesota Twins can lay claim to being the best bottom of the order ever, but if they continue to hit at the pace they have been, I think they can make a real run at taking down this 89-year-old record.
Addition:
Another way to look at this is by using OPS+. This is a metric that compares a team’s OPS relative to the league wide OPS in that season. This helps us control for things like the “steroid” and “juiced ball” eras, as it only looks how much better, or worse, you were than everyone else that season. Currently, the Twins bottom of the order has an OPS+ of 147, which means their bottom of the order OPS is 47 percent better than the 2019 league wide OPS as a whole. This is the third best mark all-time, behind only the 1908 Cubs and the 1965 Reds, who both had a 148 OPS+.
Another thing that is worth pointing out, is neither of those teams played with a DH. This gives non-DH teams a slight advantage as they only needed two hitters at the bottom of the order to perform as opposed to three hitters. When looking at other teams with a DH, the two closest teams to the 2019 Twins are the 2003 Red Sox (141 OPS+) and the 1977 White Sox (137 OPS+).
MORE FROM TWINS DAILY
— Latest Twins coverage from our writers
— Recent Twins discussion in our forums
— Follow Twins Daily via Twitter, Facebook or email
— Become a Twins Daily Caretaker


Recommended Comments
Join the conversation
You can post now and register later. If you have an account, sign in now to post with your account.
Note: Your post will require moderator approval before it will be visible.