Jump to content
Twins Daily
  • Create Account
  • A Study On Organizational Minor League Rankings


    Jesse Lund

    One of the fascinating aspects of ranking farm systems of every organization across baseball is that, to some level, it's kind of subjective. There's a general understanding on the level of Cubs-good-Padres-bad, but what's the real difference between each team? How do you mark the difference in system quality between, for example, Minnesota and Cleveland?

    Part of the challenge in finding that differentiation is that there is no single consensus on how prospects themselves are evaluated. Jonathan Mayo and Keith Law and John Sickels and Chris Mitchell will all rate prospects differently, which impacts how the system as a whole is ranked. The best part is that all of the experts understand that prospect ranking isn't an exact science, which is why we see a vast majority of any team's top prospects weigh heavily towards the 45 to 50 range on the 20-80 scale regardless of who's doing the ranking. There's a real desire to separate those few gems at the top of the pile.

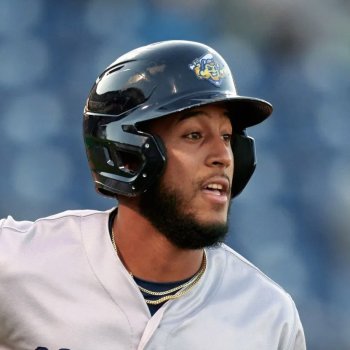
    Image courtesy of David Kohl, USA Today

    Twins Video

    Have a look at the distribution of the ratings of every club's Top 30 prospects, according to current lists at MLB.com. For the uninitiated, keep in mind that 50 is considered average. Every step down is a step below average, and every step up is another mark above.

    prospect_scatter.0.jpg

    If that chart's results look heavily skewed, it's because they are. Out of 900 prospects, 590 of them (66%) were rated as a 45. 184 (20%) were given a rating of 50. Only three out of every 20 prospects end up on either side of that range. Separating the good and elite (or otherwise) players is not only an exercise in minimizing risk in evaluation - can you imagine a world where there were 50 prospects rated as a 70, for example - but because the middle is so overwhelming it impacts those subtle separations between organizations as a whole.

    Moving on to how this can help us to determine the individual strengths of any organization's minor league system, it's pretty clear that we're running into a couple of issues: We're only looking at a club's top 30 prospects, those ratings are only sourced from one outlet, and there's no standardized way to, for example, award or penalize a club based on how their top 30 prospects were graded. Whatever we end up with here, there's no result that's going to resolutely identify exactly how well or poorly an organization's farm system is doing at any given time on an objective scale.

    What a study like this can do, however, is give us an idea of the differences are between a grouping of teams. Even though we're looking at the results of subjective data, it can be useful in helping us understand just how an organization that rates as a top five system differs from one that's middle of the pack.

    td_chart.0.jpg

    For anyone who's curious: no, the Twins' Top 30 does not include Byron Buxton. He's officially expired his rookie status, thereby eliminating his status as a prospect, so everybody slides up a spot and our friend Lewin Diaz joins the list at number 30.

    I've kept it simple. Each prospect is awarded a number of points equal to his overall rating. Corey Seager is worth 70. Exactly ten - yes, ten - Angels' prospects were awarded 40. Totals are divided by 30 to get an average, which is a nice reference to show how teams rank on a scale that no doubt moves by increments every few weeks. There are other ways to award value - 7 points for a 70, 5 points for a 60, -2 for a 40, whatever you like - but I wanted to stay away from arbitrary values.

    The strongest system here belongs to the Los Angeles Dodgers, whose 1,475 total points give them an average of 49.2. The weakest system is, of course, the Angels, whose 1,315 points give them an average of 43.8.

    rankings.0.jpg

    What we find is that the difference between a top five team, like the Rockies, and a club in the middle, like the Yankees, is actually fairly significant. They differ by just 35 points overall, but that's asking the Bombers' system to slide seven of their top 30 prospects up a level. Maybe it's tempting to think it would be easy to slide seven of those 45-rated players up to a 50, but that would give the Yankees 15 prospects with a 50 grade. It's not realistic considering the distribution of players with that mark across the league.

    Instead, the Yankees would have to turn one 45-rated player into a 65 and another into a 60. Considering there are only 20 of 900 prospects (2.2%) right now who are rated 60 or higher, magically finding two of them to drop into a system is highly unlikely. Turning three 45s into 55s might sound more doable, but that would be asking the Yankees to double the number of prospects already at that level.

    When a front office is challenged to turn around a system, I think looking at information like this helps us to see how big of a task that can be.

    There are a couple of next steps available that I'll try to take up in coming weeks. I'd like to incorporate more information from other systems, and I'd also be curious to look at the age and level of prospects to give a larger cross-section.

    MORE FROM TWINS DAILY
    — Latest Twins coverage from our writers
    — Recent Twins discussion in our forums
    — Follow Twins Daily via Twitter, Facebook or email
    — Become a Twins Daily Caretaker

     Share


    User Feedback

    Recommended Comments

    Featured Comments

    Really cool stuff.  I think that age will help a lot.  Also breaking down the systems into draft vs IFA will also help because it will show that you don't have to "tank" to build a top minor league system; you can do it by focusing on IFAs and mid to late 1st round draft picks, like the Dodgers who never tanked (and it is the only top third team in this ranking not to do so.)   This would also single out perennially bad drafting teams like the Twins... 

    Link to comment
    Share on other sites

    It also shows that what signing international players can do.  Many of the top systems went heavy above cap in international signings.  This hopefully will be addressed in the next CBA. 

    Link to comment
    Share on other sites


    I've kept it simple. Each prospect is awarded a number of points equal to his overall rating. Corey Seager is worth 70. Exactly ten - yes, ten - Angels' prospects were awarded 40. Totals are divided by 30 to get an average, which is a nice reference to show how teams rank on a scale that no doubt moves by increments every few weeks. There are other ways to award value - 7 points for a 70, 5 points for a 60, -2 for a 40, whatever you like - but I wanted to stay away from arbitrary values.

    In the 2016 Hardball Times Annual, Jeff Zimmerman wrote an article that looked at historic scouting grades from the Baseball America top-100 and calculated the subsequent WAR for each specific grade. While everyone can always disagree about how to correctly calculate value, at least this methodology looks at the historical record and comes up with values that are better than arbitrary. And I think it will provide more intuitive results to your work here.

    Link to comment
    Share on other sites

    Nice work Jesse... very thought provoking! 


    If the historical data exists, I think it would really interesting to make a cross-tab of scouting grades (30, 35, 40, 45, etc.) and ML WAR achievement, including prospect age. How often does the 45 prospect breakout, how often does the 60 prospect fail?


    I know the goal of your piece was different, but I think attaching some historical performance figures (in terms of average and distribution) to standard prospect ranking would be interesting. We all get so excited about an A or B prospect, but how much better do they end up than a guy who was given a C as a 20-year old?


    Food for thought.... maybe it's already been done too, but given the weight everyone puts on rankings, understanding the margin of error is very important. 

    Link to comment
    Share on other sites

    Great stuff here. Well researched and very illuminating. Indeed, digging into this kind of stuff illustrates the challenges of turning around a bad farm system. I think that bodes pretty well for the Twins given the states of other organizations within the division. 

    Link to comment
    Share on other sites

    Really cool stuff.


    I think keeping to a teams top 30 makes sense. You will likely get noise trying to measure a teams 30th through 50th best prospect and they rarely pan out anyways.


    The only suggestion I have is to award more points for players in the 60-70 range. These guys pan out more and are difference-makers. This system suggests two 40's are better than Seager and that is just not a trade the Dodgers consider

    Link to comment
    Share on other sites

    The only suggestion I have is to award more points for players in the 60-70 range. These guys pan out more and are difference-makers. This system suggests two 40's are better than Seager and that is just not a trade the Dodgers consider

    Yes, and it's not just not linear, it's almost exponential, how much more valuable a player gets as he moves toward the tail of the bell curve.


    I'd almost try a point system like this:

    45 = 1 pt per player

    50 = 2 pt per player

    55 = 4

    60 = 8

    65 = 16

    70 = 32


    Maybe cap it at 8, though; there is a lot of noise in these 80-point scale rankings of players, and someone's opinion that a player is a 70 and not a 65 shouldn't leapfrog a team over a lot of others.

    Link to comment
    Share on other sites


    Really cool stuff.

    I think keeping to a teams top 30 makes sense. You will likely get noise trying to measure a teams 30th through 50th best prospect and they rarely pan out anyways.

    The only suggestion I have is to award more points for players in the 60-70 range. These guys pan out more and are difference-makers. This system suggests two 40's are better than Seager and that is just not a trade the Dodgers consider


    I agree with this, and with ashburyjohn's thoughts about weighting the scores dramatically to factor in the reality of how few, and how important, those handful of elite prospects become to the success of their clubs. There aren't a dozen truly elite prospects available in any given draft. Draft order is by far the largest determinant of the eventual success, IMO. Additionally, the league has taken considerable steps to level the playing field via the allocation system, and more clubs have recently decided to commit to the draft and development process rather than spending in FA or attempting to outsmart other teams via trades.


    There just aren't many teams who are "bad at drafting" anymore, but still, playing catch-up with a depleted system is harder than ever. The ticket is drafting in one of the half-dozen top slots for consecutive drafts.


    And BTW, contrary to some opinions, the Twins have been really good at drafting for a decade or so now. A person holding to the belief that they are bad at drafting would be hard-pressed to maintain credibility if forced to present the complete facts, which would require a comparison of the results of teams who drafted each year within a few slots of where the Twins drafted.

    Edited by birdwatcher
    Link to comment
    Share on other sites


    Yes, and it's not just not linear, it's almost exponential, how much more valuable a player gets as he moves toward the tail of the bell curve.


    I'd almost try a point system like this:

    45 = 1 pt per player

    50 = 2 pt per player

    55 = 4

    60 = 8

    65 = 16

    70 = 32


    Maybe cap it at 8, though; there is a lot of noise in these 80-point scale rankings of players, and someone's opinion that a player is a 70 and not a 65 shouldn't leapfrog a team over a lot of others.


    So one Buxton (70) is worth 8 Doziers or Rosarios (55) ?

    No way :)   


    I think that it is fine the way it is.  Multipliers just skew it way on one side and, since we are talking about prospects, those 70s and 65s some times fail (eg. Shawn Abner, Bryan Bullington, Matt Bush,  Brien Taylor; all those guys were up there...) 

    Edited by Thrylos
    Link to comment
    Share on other sites


    It also shows that what signing international players can do.  Many of the top systems went heavy above cap in international signings.  This hopefully will be addressed in the next CBA. 


    I would have to search for it, and I'm still at work, so that's not going on at the moment, but a study was done that showed that a surprisingly small number of those international signees appeared on team top 10 rankings or moved very quickly in the system.

    Link to comment
    Share on other sites


    There just aren't many teams who are "bad at drafting" anymore, but still, playing catch-up with a depleted system is harder than ever. The ticket is drafting in one of the half-dozen top slots for consecutive drafts.


    Basically, this is why people ever thought the Tampa Bay Rays were good at developing players. Once they were no longer picking in the top half of the draft, their ability to draft and develop future major leaguers has been absolutely putrid.

    Edited by biggentleben
    Link to comment
    Share on other sites

    Thrylos,


    Maybe a happy medium between the number system used and and the exponential system proposed.


    Here is a list of all time prospect rankings from two years ago. This is hindsight, but I think it is fair list. Several busts were on here.


    If Alex Rodriguez was a 75 or 80, he is clearly more valuable than the Twins 29th and 30th best prospects ( 2 40's). Or you would rather have Rodriguez and 3 40's over 5 40's or even four 50's.


    http://espn.go.com/blog/sweetspot/post/_/id/11482/top-50-prospects-of-the-draft-era

    Link to comment
    Share on other sites

    Bird,


    I agree about the drafting but would contend their draft strategy could have been better.


    The biggest issue I have is the amount of early picks we have used on relief pitchers. Pretty staggering of you start about 2007. Lots of supplemental, second, third rounders. It is the cheapest position to fill in FA and to date very few have panned out.

    Link to comment
    Share on other sites

    From the Hardball Time Annual article I mentioned above:


    Historical WAR value of pre-free agent seasons for BA prospect grades:

    80 - 25.0

    75 - 18.0

    70 - 11.0

    65 - 8.5

    60 - 4.7

    55 - 2.5

    50 - 1.1

    45 - 0.4

    This view is useful, but seriously clouds the value of a stud athlete if he makes it to the major leagues.


    First, because these career WAR totals reflect both higher per-year WAR accumulation, and longer careers.


    Second, because you can't put together a winning team by promoting 50 1.0-WAR players to the majors in a season.


    The constraint of a 25-man roster looms huge, in making grade-60 prospects more valuable than 55-grade. I was being a little flippant in suggesting an actual exponential weighting (and I backed off of it in the next breath). But it's far, far from linear.

    Link to comment
    Share on other sites

    This view is useful, but seriously clouds the value of a stud athlete if he makes it to the major leagues.


    First, because these career WAR totals reflect both higher per-year WAR accumulation, and longer careers.


    Second, because you can't put together a winning team by promoting 50 1.0-WAR players to the majors in a season.


    The constraint of a 25-man roster looms huge, in making grade-60 prospects more valuable than 55-grade. I was being a little flippant in suggesting an actual exponential weighting (and I backed off of it in the next breath). But it's far, far from linear.

    Yeah. The Sum of the Twins position players last year was 11.8. Not much more than Mike Trout.


    And our pitchers were 16. So that assumes a AA team would win about 55 games (83 games - 28 war).


    So in theory, You could take a AA team and give them Trout, Kershaw, and Harper and they could win 83 games.

    Link to comment
    Share on other sites


    Bird,

    I agree about the drafting but would contend their draft strategy could have been better.

    The biggest issue I have is the amount of early picks we have used on relief pitchers. Pretty staggering of you start about 2007. Lots of supplemental, second, third rounders. It is the cheapest position to fill in FA and to date very few have panned out.


    I understand the issue and more or less agree with you, but with three caveats: first, they weren't using early first-round picks, and once we get down to the 40-50 overall selections, where virtually every prospect has flaws to overcome, it's arguable that picking the occasional flamethrower is a good idea; second, the jury is still out on a lot of these prospects; and third, the KC success story might be telling us that these prospects have been under-valued in the draft.

    Link to comment
    Share on other sites


    I understand the issue and more or less agree with you, but with three caveats: first, they weren't using early first-round picks, and once we get down to the 40-50 overall selections, where virtually every prospect has flaws to overcome, it's arguable that picking the occasional flamethrower is a good idea; second, the jury is still out on a lot of these prospects; and third, the KC success story might be telling us that these prospects have been under-valued in the draft.


    Yeah, but in the 2008 and 2009 drafts for example, this was before RP's started getting more expensive.  You could sign a set up guy for 2 years in the 4-6m range.  So I don't get why you use the 27th pick on Carlos Gutierrez for example.   Bulock and Tootle 70th and 101st overall. 


    If all players in this range are a crap shoot (which they probably are), I would favor a catcher, SS, or starting pitcher so if they do turn out you get more value, harder and more expensive roles to fill, etc.

    Link to comment
    Share on other sites

    Great discussion here. I think it's awesome that Jesse compiled this stuff for us to chew on.


    I also agree with the main critique of it - that the point system implies that a "60" is only 20% better than a "50". The scouting point system isn't made to determine value. It was made to give scouts an easy way to differentiate between similar players.


    To that end, I really like the WAR list that Markos provided. Yes, it has career WAR, but really what Jesse is working through here is "What is the value of these players to the organization?" That boils down to "What is the value of these players in the first six years of their MLB career to the organization?" I bet that corresponds very closely with career WAR, so I'm good with using it.


    Anyone want to do the same excercise using WAR point system?

    Link to comment
    Share on other sites


    and third, the KC success story might be telling us that these prospects have been under-valued in the draft.

    If they are under-valued in the draft, why would it be good for the Twins to be spending decent value (2nd through 4th round picks) on them?  That would be like saying OBP was undervalued in the Moneyball era -- and then going out and spending big or drafting high for OBP players.  If it was undervalued, you should have been able to get it cheaper.


    That said, I don't think the Royals success tells us much about RP in the draft specifically.  In fact, outside of drafting Holland in the 10th round in 2007, they haven't really relied on drafting relievers at all.


    After bullpens, if the next key to MLB success is revealed to be undervalued platoon players, that still doesn't mean it's a good idea to draft undervalued platoon players in the top rounds of the draft.

    Link to comment
    Share on other sites

    Ok, I've used the WAR values to recreate the points. Here are the details:


    https://docs.google.com/spreadsheets/d/1G3FVpKs0rA7Wlt8R6K8Zt-zemowor1i7qiHIxGRIlHY/edit?usp=sharing


    And here are the sorted final WAR values for the top 30 prospects in each system by team:


    TOTAL
    LAD 41.5
    MIL 35
    TEX 32.6
    ATL 31.9
    PHI 31
    COL 29.2
    CHN 28.5
    HOU 28.2
    WAS 28.2
    PIT 26.7
    BOS 25.2
    CIN 23
    TB 22.7
    MIN 20.7
    CLE 20.5
    NYM 19.7
    NYY 19.5
    SD 18
    OAK 16.5
    STL 16.2
    SFG 13
    TOR 13
    ARI 11
    CHA 11
    KC 11
    SEA 10
    BLT 7
    DET 5.5
    LAA 4.5
    MIA 4.5


    I'll also just note that if Buxton is a 70 (I don't know if that was true) and he still would have been on the list, the Twins would have been at 31.7, 5th overall.

    Link to comment
    Share on other sites


    Join the conversation

    You can post now and register later. If you have an account, sign in now to post with your account.
    Note: Your post will require moderator approval before it will be visible.

    Guest
    Add a comment...

    ×   Pasted as rich text.   Paste as plain text instead

      Only 75 emoji are allowed.

    ×   Your link has been automatically embedded.   Display as a link instead

    ×   Your previous content has been restored.   Clear editor

    ×   You cannot paste images directly. Upload or insert images from URL.

    Loading...

×
×
  • Create New...