-
Blog awstafki
-
The Lurker's Annual
-
Mike Sixel's Blog
-
Twins fan in Texas
-
highlander's Blog
-
Patrick Wozniak's Blog
-
Blog dennyhocking4HOF
-
From the Plaza
-
The Special Season
-
Twins Daily's Blog
-
Blog Twins best friend
-
Kyle Eliason's Blog
-
Extra Innings
-
SkinCell Pro: How Does Remove Mole & Skin Tag Work?
-
Blog Badsmerf
-
mikelink45's Blog
-
MT Feelings
-
Keto Burn Max Benefits
-
Blog crapforks
-
Off The Baggy
-
VikingTwinTwolf's Blog
-
A Blog to Be Named Later
-
Cormac's Corner
-
Blog MaureenHill
-
Halsey Hall Chapter of SABR
-
Road Tripping with the Twins
-
Greg Allen
-
Classic Minnesota Twins
-
The Line of Mendoza
-
BombazoMLB
-
Blog Twins Daily Admin
-
joshykid1's Blog
-
What if the Twins had drafted Prior or Teixeira instead of Mauer?
-
the_brute_squad's Blog
-
Better Baseball Is Ahead
-
Nick's Twins Blog
-
Blog jianfu
-
joshykid1's Blog
-
The PTBNL
-
Levi Hansen
-
SethSpeaks.net
-
Blog leshaadawson
-
Underwriting the Twins
-
Small Sample Size
-
parkerb's Blog
-
Tim
-
TwinsGeek.com
-
Blog Roaddog
-
Mauerpower's Blog
-
SotaPop's Blog
-
Face facts!!!
-
Over the Baggy
-
curt1965's Blog
-
Heezy1323's Blog
-
LA Vikes Fan
-
North Dakota Twins Fan
-
Blog Reginald Maudling's Shin
-
curt1965's Blog
-
Miller1234's Blog
-
Twins Curmudgeon
-
Blog Kirsten Brown
-
if we aint spendin 140 million
-
Boone's Blog
-
Rounding Third
-
Kirilloff & Co.
-
Shallow Thoughts - bean5302
-
The Hanging SL
-
Red Wing Squawk
-
Distraction via Baseball
-
Nine of twelve's Blog
-
Notes From The Neds
-
Blog Lindsay Guentzel
-
Blog Karl
-
Vance_Christianson's Blog
-
Curveball Blog
-
waltomeal's Blog
-
bronald3030
-
Knuckleballs - JC
-
Blog jrzf713
-
The Minor League Lifestyle
-
Jason Kubel is America
-
weneedjackmorris' Blog
-
Mahlk
-
Off The Mark
-
Blog freightmaster
-
Playin' Catch
-
Sethmoko's Blog
-
Dome Dogg's Blog
-
Lev's Musings
-
Blog Scott Povolny
-
Blog COtwin
-
Hrbowski's Blog
-
Minnesota Twins Whine Line
-
Bomba Blog
-
cjm0926's Blogs
-
Blog Chad Jacobsen
-
Blog ScottyBroco
-
tobi0040's Blog
-
Back Office Twins Baseball Blog
-
DannySD's Blog
-
nobitadora's Blog
-
blogs_blog_1812
-
Greg Fransen
-
Blog Adam Krueger
-
Hammered (adj.) Heavily inebriated, though to a lesser extent than ****faced.
-
Thegrin's Blog
-
3rd Inning Stretch's Blog
-
Mark Ferretti
-
Jeremy Nygaard
-
The W.A.R. room
-
Christopher Fee's Blog
-
Postma Posts
-
Rolondo's Blog
-
blogs_blog_1814
-
Fantasy GM
-
Blog Fanatic Jack
-
Dominican Adventure
-
Cory Engelhardt's Blog
-
markthomas' Blog
-
blogs_blog_1815
-
Un/Necessary Sports Drivel
-
Blog AJPettersen
-
Blog AllhopeisgoneMNTWINS
-
BW on the Beat
-
jfeyereisn17's Blog
-
2020 Offseason Blueprint
-
The Hot Corner
-
Blog TimShibuya
-
Fumi Saito's Blog
-
This Twins Fans Thoughts
-
Long Live La Tortuga
-
Baseball Therapy
-
Blog TonyDavis
-
Blog Danchat
-
sdtwins37's Blog
-
Thinking Outside the Box
-
dbminn
-
Proclamations from the Mad King
-
Blog travistwinstalk
-
jokin's Blog
-
Thoughts from The Catch
-
BlakeAsk's Blog
-
Bad Loser Blog
-
Tom Schreier's Blog
-
less cowBlog
-
Hansen101's Blog
-
Musings of a Madman
-
The Gopher Hole
-
2020 Twins BluePrint - HotDish Surprise
-
Travis Kriens
-
Blog bkucko
-
The Circleback Blog
-
All Things Twins
-
batting 9th and playing right field
-
Blog iTwins
-
Drinking at the 573
-
The Thirsty Crow and the google boy from peepeganj
-
Catching Some Zs
-
Favorite Twins Memory
-
Blog TCAnelle
-
Singles off the Wall
-
tarheeltwinsfan's Blog
-
Jack Griffin's Blog
-
A View From The Roof
-
The Blog Days of Summer
-
Jordan1212's Blog
-
You Shouldn't Have Lost
-
Jeff D. - Twins Geezer
-
TwinsTakes.com Blog on TwinsDaily.com - Our Takes, Your Takes, TwinsTakes.com!
-
Blog SgtSchmidt11
-
Dantes929's Blog
-
Critical Thinking
-
Old Tom
-
Blog Matt VS
-
Blog RickPrescott
-
The Dollar Dome Dog
-
Travis M's Blog
-
Diamond Dollars
-
Rick Heinecke
-
Blog jorgenswest
-
Twinsfan4life
-
Travis M's Interviews
-
whatyouknowtwinsfan's Blog
-
An Unconventional Trade Target
-
Blog righty8383
-
Blog TwinsWolvesLynxBlog
-
Supfin99's Blog
-
tarheeltwinsfan's Blog
-
SportsGuyDalton's Blog
-
Blog glunn
-
Blog yumen0808
-
Unkind Bounces
-
Doctor Gast's Blog
-
AmyA
-
One Man's View From Section 231
-
Don't Feed the Greed? What does that mean...
-
Diesel's Blog
-
Curtis DeBerg
-
Blog denarded
-
Blog zymy0813
-
Twins Peak
-
Minnesota Twins Health and Performance: A Blog by Lucas Seehafer PT
-
Paul Walerius
-
Blog kirbyelway
-
Blog JP3700
-
twinssouth's Blog
-
Ports on Sports Blog
-
Analytic Adventures
-
Blog Twins Fan From Afar
-
Blog E. Andrew
-
The 10th Inning Stretch
-
Hansblog
-
Depressed Twins Blog
-
Blog twinsarmchairgm
-
Pitz Hits
-
samthetwinsfan's Blog
-
Updated Farm System rankings
-
Blog JB (the Original)
-
soofootinsfan37's Blog
-
You Can Read This For Free
-
One Post Blog
-
Blog Dez Tobin
-
South Dakota Tom's Blog
-
hrenlazar2019's Blog
-
MNSotaSportsGal Twins Takes
-
Brewed in the Trough
-
Blog kemics
-
Blog AM.
-
DerektheDOM's Blog
-
Twins Tunes
-
Home & Away
-
Blog jtrinaldi
-
Blog Bill
-
Not Another Baseball Blog
-
Down on the Farm
-
Most likely pitchers making their MLB debut in 2021 for Twins.
-
Alex Boxwell
-
Blog Wookiee of the Year
-
mike8791's Blog
-
Pensacola Blue Wahoos: Photo-A-Day
-
Puckets Pond
-
Bloggy McBloggerson talks ball
-
Blog Jim H
-
A trade for the off season
-
curt1965's Blog
-
Kasota Gold
-
The POSTseason
-
Hunter McCall
-
Blog guski
-
Blog rickyriolo
-
SgtSchmidt11's Blog
-
Twinternationals
-
Seamus Kelly
-
Blog birdwatcher
-
Blog acrozelle
-
Axel Kohagen's Catastrophic Overreactions
-
Bashwood12's Blog
-
Spicer's Baseball Movie Reviews
-
Twins on Wheat; Add Mayo
-
Beyond the Metrodome
-
Blog yangxq0827
-
The Pat-Man Saga
-
TheTeufelShuffle's Blog
-
ebergdib's blog
-
Adam Neisen
-
Blog Thegrin
-
Zachary's Blog
-
scottyc35
-
Danchat's Aggregated Prospect Rankings
-
Which young player should we be the most optimistic about going forward?
-
Thrylos' Blog - select Tenth Inning Stretch posts
-
Blog taune
-
scottyc35's Blog
-
Adam Friedman
-
World's Greatest Online Magazine
-
Blog tweety2012
-
DRizzo's Blog
-
mrtwinsfan's Blog
-
Ben Reimler
-
Blog asmus_ndsu
-
Otto Gets Blotto
-
Betsy Twins Report
-
Cory Moen
-
Blog shawntheroad
-
Blog David-14
-
Neil C. Lahammer - Winter Caravan News
-
Blog Buddy14
-
Blog keithanderson
-
Players I would be looking at now after Correa signing
-
Blog Topperanton
-
Blog lightfoot789
-
And We'll See You Tomorrow Night
-
Blog Axel Kohagen
-
Blog Lesser Dali
-
Harrison Smith’s Blog
-
Blog Neinstein
-
Blog Bob Sacamento
-
Blog J-Dog Dungan
-
Thoughts of a Bullpen Catcher
-
Luke Thompson
-
Blog Dilligaf69
-
blogs_blog_1599
-
Twin Minds
-
My Opening Day Poem
-
Blog Teflon
-
Blog yanking it out...
-
Blog Anare
-
Blog Charlie Beattie
-
Blog Coach J
-
What to do with Morneau?
-
Peanuts from Heaven
-
Blog Physics Guy
-
Twins Adjacent
-
Field of Twins
-
Martin Schlegel's Blog
-
The Long View
-
Blog grumpyrob
-
Off The Mark
-
Blog Jeff A
-
Blog jwestbrock
-
by Matt Sisk
-
Blog Sarah
-
Blog RodneyKline
-
Blog JeffB
-
Anorthagen's Twins Daily Blogs
-
Low Profile MI Trade
-
Blog CC7
-
Blog dwintheiser
-
Blog Docsilly
-
Blog cmathewson
-
Blog mnfireman
-
Blog twinsfanstl
-
Blog dave_dw
-
Blog MN_Twins_Live
-
Standing Room Only
-
Blog gkasper
-
Blog puck34
-
Blog Old Twins Cap
-
Blog diehardtwinsfan
-
Blog Twinfan & Dad
-
Blog LimestoneBaggy
-
Blog Brian Mozey
-
vqt94648's Blog
-
Blog Loosey
-
Blog fairweather
-
World Series Champions 2088
-
Blog Drtwins
-
Blog peterb18
-
Blog LindaU
-
Kevin Slowey was Framed!
-
Blog Christopher Fee
-
Very Well Then
-
Pitch2Contact.com
-
A View from the Slot
-
Blog severson09
-
Blog husker brian
-
Blog Ray Tapajna
-
Sell high?
-
Blog bogeypepsi
-
Blog tshide
-
Blog Gene Larkin Fan Club
-
Blog jimbo92107
-
Blog DefinitelyNotVodkaDave
-
Blog Cap'n Piranha
-
The Blog Formerly Known as Undomed
-
Frank Vantur's Blog
-
Blog Ricola
-
Blog AScheib50
-
SamGoody's Blog
-
Blog clutterheart
-
Blog Trent Condon
-
Blog bwille
-
blogs_blog_1635
-
Blog strumdatjag
-
Blog huhguy
-
blogs_blog_1636
-
Blog 3rd Inning Stretch
-
Blog 10PagesOfClearBlueSky
-
blogs_blog_1637
-
Blog Tyomoth
-
SD Buhr/Jim Crikket
-
blogs_blog_1638
-
Blog bear333
-
Blog sln477
-
Blog abbylucy
-
Blog Gernzy
-
Troy's Twins Thoughts
-
Blog OtherHoward219
-
blogs_blog_1642
-
Blog ScrapTheNickname
-
Blog TicketKing
-
Blog sotasports9
-
Twins Rubes
-
Blog goulik
-
Hosken's Blog
-
Blog one_eyed_jack
-
Blog joelindell
-
Blog rikker49
-
Blog nickschubert
-
Blog DreInWA
-
You're Not Reading This
-
Blog Hugh Morris
-
The Blog Formerly Known as Undomed
-
Kottke's Cuts
-
Blog Dakota Watts
-
Blog markroehl
-
Blog jjswol
-
Blog Tibs
-
blogs_blog_1654
-
Blog jlovren
-
Blog Boone
-
Puckmen's Blog
-
Minnesota native to attend Twins predraft workout
-
Blog obryaneu
-
Blog JohnFoley
-
Blog TwinsArmChairGM_Jon
-
Bloop Singles
-
Blog Ryan Atkins
-
Blog the blade
-
Blog Lonestar
-
Blog jdotmcmahon
-
Blog WayneJimenezubc
-
Blog Sconnie
-
Blog PogueBear
-
Blog pierre75275
-
cHawk Talks Baseball
-
Blog Paul Bebus
-
flyballs in orbit
-
Blog A33bates
-
Blog lunchboxhero_4
-
lidefom746's Blog
-
Blog coddlenomore
-
Blog Trevor0333
-
Blog lee_the_twins_fan
-
Blog StreetOfFire
-
Blog clark47dorsey
-
Texastwinsfan blog
-
Blog KCasey
-
Blog Joey Lindseth
-
Blog jakelovesgolf
-
Blog mchokozie
-
Thoughts from the Stands
-
cHawk’s Blog
-
Blog best game in the world
-
Heather's thoughts
-
Blog sammy0eaton
-
HitInAPinch's Blog
-
Blog Mauerpower
-
Blog Jdosen
-
Blog twinsfanohio
-
Beyond the Limestone
-
Blog dougkoebernick
-
Get to know 'em
-
5 Tool Blog
-
Cole Trace
-
Blog Sunglasses
-
Blog CTB_NickC
-
Blog Colin.O'Donnell
-
"And we'll see ya' ... tomorrow night."
-
Blog richardkr34
-
Gopher Baseball with Luke Pettersen
-
Blog KelvinBoyerxrg
-
Blog twinsfan34
-
Blog CaryMuellerlib
-
Blog jtkoupal
-
FunnyPenguin's Blog
-
Blog Sierra Szeto
-
Blog ExiledInSeattle
-
A Realistic Fix to the 2014 Twins
-
Blog naksh
-
Blog bellajelcooper
-
rickymartin's Blog
-
Blog twinsajsf
-
Blog keeth
-
Blog Murphy Vasterling Cannon
-
Twins Winter Caravan
-
Blog tracygame
-
Blog rjohnso4
-
Half a Platoon
-
Blog jangofelixak
-
Blog SirClive
-
tooslowandoldnow's Blog
-
Blog Troy Larson
-
Blog thetank
-
nicksaviking blog
-
Blog iekfWjnrxb
-
Blog SouthDakotaFarmer
-
Bill Parker
-
Left Coast Bias
-
Blog tobi0040
-
Lee-The-Twins-Fan's Blog
-
Blog foe-of-nin
-
Blog cocosoup
-
Minnesota Groan
-
Blog wRenita5
-
rgvtwinstalk
-
Major Minnesotans
-
Blog Aaron 12
-
Blog janewong
-
The Twins Almanac
-
Blog boys
-
Blog bennep
-
Hambino the Great's Blog
-
Blog JadaKingg25
-
Jesse Lund's Blog
-
Blog Brabes1987
-
RealStoriesMN
-
Blog sanal101
-
Blog Spikecurveball
-
Blog Devereaux
-
D-mac's Blog
-
Blog tarheeltwinsfan
-
kakakhan's Blog
-
Blog Oliver
-
Blog travis_aune
-
Twins and Losses
-
In My Opinion
-
Blog ieveretgte4f
-
Blog Sam Morley
-
Pinto's Perspective
-
Blog curt1965
-
VeryWellThen's Blog
-
Extcs
-
Minnesota Foul Play-by-play
-
Dave The Dastardly's Blog
-
Blog winunaarec
-
Negativity Police's Blog
-
Blog Robb Jeffries
-
Adam Houck's Blog
-
SaintsTrain
-
Loosey's Blog
-
Blog EE in Big D
-
Talkin' Twins with Jonathon
-
Steve Penz's Blog
-
Blog jtequilabermeah
-
The Tenth Inning Stretch
-
Apathy for the Game
-
Dave The Dastardly's Blog
-
Blog hmariloustarkk
-
Car detailing
-
Blog Brendan Kennealy
-
Twins Fan From Afar's Blog
-
Visit500
-
Blog totocc
-
SD Buhr's Blog
-
KirbyHawk75's Blog
-
Blog Bark's Lounge
-
huhguy's Blog
-
Blog TwinsFanLV
-
NumberThree's Blog
-
Blog pandorajewelry
-
The Go Gonzo Journal Twins Blog
-
Twinsnerd123's Blog
-
Blog cClevelandSmialekp
-
Talk to Contact
-
Boo-urns
-
Blog silverslugger
-
jtkoupal's Blog
-
Broker's Blog
-
Blog Twinsoholic
-
diehardtwinsfan's Blog
-
Brad's Blog
-
Javier Maschrano - the rising star of Argentina
-
Be Always in Fashion &in Trendy Look
-
Blog Salazar
-
curt1965's Blog
-
Be Always in Fashion &in Trendy Look
-
ThejacKmp's Blog
-
Blog vMaymeHansone
-
stringer bell's Blog
-
Blog brvama
-
AJPettersen's Blog
-
WiscoTwin
-
Rants (not Rantz)
-
iec23966's Blog
-
Blog loisebottorf83
-
CodyB's Blog
-
Staying Positive
-
Target Field of Dreams' Blog
-
Intentional Balk
-
Blog rodmccray11282
-
ReturnOfShaneMack's Blog
-
Blog SksippSvefdklyn
-
A blog about the Twins & more
-
Thome the Moneyball
-
tobi0040's Blog
-
Lefty74's Blog
-
USAFChief's Blog
-
tobi0040's Blog
-
Tony Nato's Blog
-
Clear's Blog
-
Blog LeeStevensonuuf
-
Waking up the Twins
-
Blog GrahamCharleshqr
-
First Base and the legacy of Kent Hrbek
-
carly148
-
Blog MWLFan
-
Minnie Paul and Mary
-
twinstarheelsfan's Blog
-
This game's fun, OK?
-
Blog TimeAgreell
-
Tsuyoshi's Island
-
NASCAR Steve's Blog
-
Kevin Horner's Blog
-
blogs_blog_1742
-
Blog CDog
-
Hold for the Batter
-
John the Analytics Guy
-
mrmpls' Blog
-
Zlog
-
samberry's Blog
-
nmtwinsfan's Blog
-
Under Teflon Skies
-
Views from the road
-
St. Paul Saints
-
Blog tkyokoperkinsn
-
Alskn's Northern Lights
-
Talkin' Turnstiles
-
Find Stats Elsewhere
-
Blog LaBombo
-
hugelycat's Blog
-
Deduno Abides' Blog
-
Milldaddy35's Blog Area
-
Blog Fire Dan Gladden
-
Baseball Intelligence
-
framedoctor's Blog
-
Blog Riverbrian
-
Blog Brandon
-
Organizational Depth Chart
-
Left Field Gap
-
gtkilla
-
Hicks' Left-Handed Helmets
-
MauerState7's Blog
-
80MPH Changeup
-
Twins Pitch Breakdown
-
What you know about that blog
-
Blog DaTwins
-
positive1's Blog
-
rikker49's Blog
-
baxterpope15's Blog
-
Blog ThejacKmp
-
Random Thoughts About Baseball
-
Don't Feed the Greed Guy's Blog
-
Run Prevention
-
Blog ericchri
-
pierre75275's Blog
-
Don't Feed the Greed Guy's Blog
-
Cargo Cult Sabermetrics
-
Blog 81Exposruledbaseball
-
Deduno Abides' Blog
-
David Howell's Blog
-
Blog daanderson20
-
Twin Billing
-
sorney's Blog
-
TCAnelle's Blog
-
Blog shs_59
-
rikker49's Blog
-
Crackin' Wax's Cardboard Corner
-
Blog jm3319
-
jsteve96's Blog
-
The Always Fashionable; Uncle Charlie
-
Blog stringer bell
-
twinssouth's Blog
-
Baseball Good
-
Blog everettegalr
-
twinsfan34's Blog
-
menthmike's Blog
-
Blog Obie
-
B Richard's Blog
-
Brazilian Twins Territory
-
The Hidden Baseball
-
Blog SpinnesotaGirl
-
Marthaler
-
InfieldFlyRuled
-
Coopcarlson3's Blog
-
Blog SoDakTwinsFan5
-
Blog LastOnePicked
-
Bob Sacamento's Blog
-
MnTwinsTalk's Blog
-
Blog Top Gun
-
Twinfan & Dad's Blog
-
Nebtwinsfan's Blog
-
Blog TKGuy
-
GLO Blog
-
Ben Fadden's Blog
-
ajcondon's Blog
-
Blog TheMind07
-
TwinkiePower's Blog
-
Blog Michael Blomquist
-
VeryWellThen
-
MN_ExPat's Blog
-
Channing1964's Blog
-
Blog Darin Bratsch
-
Twin's Organizational News
-
Around The Horn
-
Blog beckmt
-
jjswol's Twins Trivia Blog
-
BeantownTwinsFan's Blog
-
Blog YourHouseIsMyHouse
-
jjswol's Twins Trivia Blog
-
Blog jay
-
SF Twins Fan's Blog
-
Morneau
-
TNTwinsFan's Blog
-
Musings from Twins Territory
-
Original Twin
-
Blog El Guapo
-
Doubles' Blog
-
Kirbek's Leaps and Pulls
-
Blog jokin
-
Brandon's Blog
-
A Look Back
-
Science of Baseball
-
Blog IdahoPilgrim
-
Sam Morley's Blog
-
oregontwin's Blog
-
Rounding Second
-
Blog Lyric53
-
The Curse of the Trees
-
gagu's Blog
-
Twins in CA
-
Blog Oldgoat_MN
-
Giant Baseball Cards
-
Blog twinfan49
-
docsillyseth's Blog
-
Kirby O'Connor's Blog
-
dfklgkoc
-
Blog ContinuumGuy
-
Wille's Way
-
Minnesota Sports Statistics Analysis
-
Ryan Stephan's Twinpinions
-
blogs_blog_2805
-
Blog tradingadvantage
-
brvama's Blog
-
Minnesota SSA's Blog
-
Danchat's Strat-O-Matic Blog
-
Blog Chance
-
NoCryingInBaseball's Blog
-
It Takes All Kinds
-
TFRazor's Blog
-
Blog twinslover
-
Sarah's Blog
-
theJemmer's Blog
-
Spikecurveball's Blog
-
Four Six Three
-
blogs_blog_2809
-
2012 Draft.
-
travistwinstalk's Blog
-
Seth Stohs' Blog
-
Through a Child's Eyes
-
Colexalean Supplement Reviews
-
Blog jiamay
-
Dome Dogg's Blog
-
Fanspeak's Twins and AL Central Blog
-
In Pursuit of Pennants
-
minnesotasportsunlimited's Blog
-
Jacob Booth Blogs
-
Blog stewthornley
-
mickeymental's Blog
-
Baseball Bat's Offseason Blueprint
-
AJswarley's Blog
-
Twins Outsider's Blog
-
Blog h2oface
-
Iowa Twins Fan
-
Twinkie Talk
-
Battle Your Tail Off
-
JackWhite's Blog
-
bikram's Blog
-
Twins Nation Podcast
 I will start this article by saying, I am only referencing fielding metrics generated by Statcast that are available on Baseball Savant. While many of the defensive metrics on sites like Fangraphs and Baseball Reference could be helpful, they are, at least for outfielders, outdated, and nowhere near...
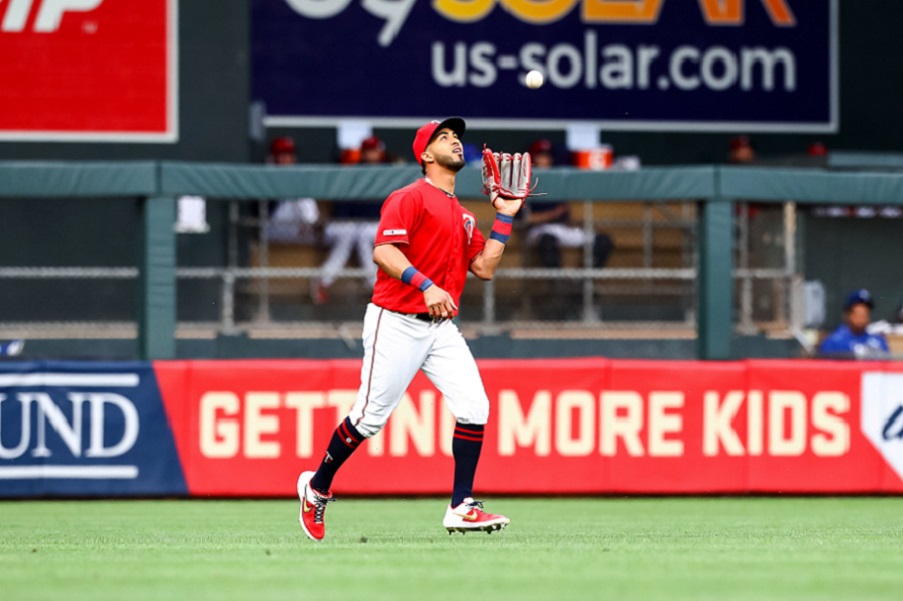
 With all of the questions the Minnesota Twins have had surrounding most of their team over the past few years, one area of the team that has been steady has been the outfield. Sure, Byron Buxton has had his fair share of issues with the bat and staying healthy, but there has never been a question ab...


 3
3 0
0


