Jump to content
Twins Daily
  • Create Account
  • New Baseballs Impacting Triple-A Numbers


    Cody Christie

    Major League Baseball is using a juiced baseball. At least that is the belief of a lot people watching the game. Even scouts have complained about the difficulties in evaluating talent between the minor leagues and the big leagues. Triple-A teams started using the same baseball as the big leagues this year and it has certainly impacted the game.

    How do Rochester’s numbers stack up with the switch to the new baseball?

    Image courtesy of Seth Stohs, Twins Daily (Nick Gordon)

    Twins Video

    2018 Season Recap

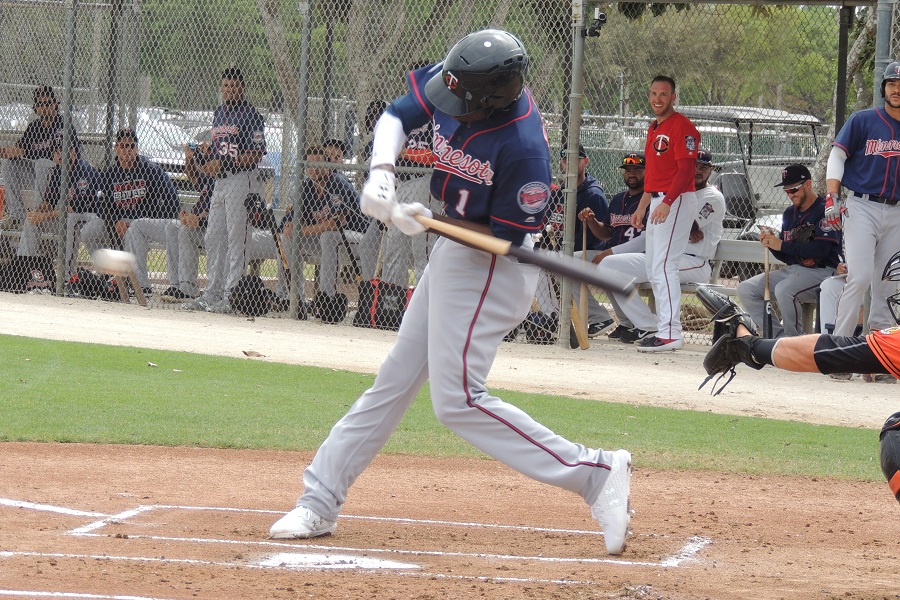
    In 140 games last season, Rochester hit .227/.304/.346 (.650) with 97 home runs, 24 triples and 193 doubles. For players that made at least 70 appearances with Rochester, Willians Astudillio led the way with a .782 OPS. Kennys Vargas ranked second with a .752 OPS. Vargas was first on the team in home runs (21) and doubles (23). Astudillo ranked second in both of those categories with 12 homers and 17 doubles.

    Rochester was below the league average in most hitting categories. International League teams hit .252/.320/.389 (.709). The Red Wings ranked second to last in home runs and last in doubles. However, Rochester struck out the fourth least in the league and ranked in the middle of the pack in walks.

    ccs-25-0-54089200-1558379499.png

    Rochester pitchers tossed over 1200 innings last year. In those appearances, the club averaged a 3.39 ERA with a 1.27 WHIP, an 8.5 SO/9 and a 3.3 BB/9. Stephen Gonsalves started 18 games and posted a 2.96 ERA with a 95 to 55 strike out to walk ratio. Zack Littell’s 15 starts were second on the team and he had a 3.57 ERA while striking out 98 and walking 40.

    Red Wings pitchers fared better than hitters when compared to league averages. Rochester’s 3.39 ranked as the best in the league. The club was also one of seven teams to have double-digit shutouts. Only one team allowed fewer hits and Rochester was one of four clubs to allow fewer than 100 home runs.

    ccs-25-0-27297500-1558379599.png

    2019 Season Explosion

    With the new baseball this season, International League teams are hitting .263/.342/.441 (.783). That means slugging percentage is up 52 points and OPS is up 74 points. After being well below league average last season, Rochester hitters are near league average this year as they are hitting .260/.334/.439 (.773). Three players have over 90 plate appearances and an OPS of .878 or higher (Jordany Valdespin, Drew Maggi, and Luke Raley).

    ccs-25-0-45988400-1558379882.png

    While Rochester’s hitters have improved, the pitchers have gone the opposite direction. International League pitchers have combined for a 4.88 ERA with a 1.44 WHIP and 9.1 SO/9. Red Wings pitchers have the second worst ERA in the league (5.91) and they have allowed the fourth most home runs (57). Also, the club’s 1.52 WHIP is the third worst total in the league. One positive sign is the club has the second highest SO/9 total in the league (10.4 SO/9).

    Lewis Thorpe has started the most games for Rochester this season. In 41 2/3 innings, he has a 6.70 ERA with a 1.37 WHIP with 53 strikeouts and 12 walks. Zack Littell has thrown the most innings for the Red Wings. He has a 4.19 ERA in 43 innings with 45 strikeouts and 16 walks.

    ccs-25-0-54981600-1558379888.png

    Are the new baseball’s going to impact how scouts look at Triple-A players? Leave a COMMENT and start the discussion.

    MORE FROM TWINS DAILY
    — Latest Twins coverage from our writers
    — Recent Twins discussion in our forums
    — Follow Twins Daily via Twitter, Facebook or email
    — Become a Twins Daily Caretaker

     Share


    User Feedback

    Recommended Comments

    Featured Comments

    Given the turnover on a minor league team, I don't think team by team numbers make a lot of sense. I think the best way to judge this is to look at the league numbers from the last few seasons...


    I'm assuming there's a big jump from last years numbers to this years, but I'd also be curious if there was an upwards trend prior to that. 

    Link to comment
    Share on other sites

    Another bit of evidence that the baseball is 'juiced.' What I'd really like to see, though, is a use of stats and tracking data which plot exit velocity and launch angle versus distance traveled, for the old balls versus the new balls.


    I'd be shocked if nobody has done this yet, but I haven't seen any plots like this.


    I tend to believe that we'll see a higher distance traveled from the new balls, but the paradigm shift in batting approach the last few years makes it really hard to judge from just the league batting statistics and total homeruns.

    Link to comment
    Share on other sites

    Maybe, but looking at Rochester along with 80% turnover will not help you answer this question.   

    Here is runs per game data for both AAA leagues as a whole:


    AAA
    International League
    2019: 5.22 Runs per game
    2018: 4.16 R/G
    2017: 4.27 R/G

    Pacific Coast League
    2019: 5.67 R/G
    2018: 4.97 R/G
    2017: 5.05 R/G


    So one can say that the ball might be juiced but still is too few points.   More data. AA Data:

    AA
    Southern League
    2019: 3.77 R/G
    2018: 4.29 R/G
    2017: 3.95 R/G

    Eastern League
    2019: 4.03 R/G
    2018: 4.42 R/G
    2017: 4.32 R/G

    Texas League
    2019: 4.88 R/G
    2018: 4.59 R/G
    2017: 4.35 R/G


    All over the place, which is what it supposed to be if random, but both Eastern and Southern leagues seem weaker this season.  If most AA players from last season moved to AAA, the difference in R/G might be due to better hitters/worse pitchers or other things, like the weather ;) 


    Too small sample size, in other words.

    Link to comment
    Share on other sites


    Maybe, but looking at Rochester along with 80% turnover will not help you answer this question.   

    Here is runs per game data for both AAA leagues as a whole:


    AAA
    International League
    2019: 5.22 Runs per game
    2018: 4.16 R/G
    2017: 4.27 R/G

    Pacific Coast League
    2019: 5.67 R/G
    2018: 4.97 R/G
    2017: 5.05 R/G


    So one can say that the ball might be juiced but still is too few points.   More data. AA Data:

    AA
    Southern League
    2019: 3.77 R/G
    2018: 4.29 R/G
    2017: 3.95 R/G

    Eastern League
    2019: 4.03 R/G
    2018: 4.42 R/G
    2017: 4.32 R/G

    Texas League
    2019: 4.88 R/G
    2018: 4.59 R/G
    2017: 4.35 R/G


    All over the place, which is what it supposed to be if random, but both Eastern and Southern leagues seem weaker this season.  If most AA players from last season moved to AAA, the difference in R/G might be due to better hitters/worse pitchers or other things, like the weather ;)


    Too small sample size, in other words.


    not sure about that...


    my back of the napkin eye test on the math says the AA numbers are close enough together. I'd bet if you took those numbers out 20-30 years, the AA numbers would probably be around a standard deviation. I'm not sure I could say that with the AAA numbers.


    You're right that we need more of a sample, but there's quite the jump in AAA compared to AA. We all know the PCL has been high, but the IL was in line with AA up until this year. 


    I am somewhat curious about trending data as we all know the emphasis in things like launch angle over the last few seasons. 

    Link to comment
    Share on other sites


    AAA

    International League
    2019: 5.22 Runs per game
    2018: 4.16 R/G


    Unless you can find another league that saw a full run increase in one year recently, I'm pretty confident the ball change is having an effect here. Especially since the next single biggest single year change in your data here is the 2019 PCL adding +.7 runs per game, also with the ball change.


    (My guess is that since the PCL was already an offensive-friendly environment, it's hitting a bit more of an upper bound on scoring, which is why it hasn't risen quite as much as the IL. Also, maybe its players/coaches are already a bit more adept at mitigating the effects of extreme offense?)


    Obviously we'll know more about the degree of the effect by the end of the year.

    Edited by spycake
    Link to comment
    Share on other sites


    Join the conversation

    You can post now and register later. If you have an account, sign in now to post with your account.
    Note: Your post will require moderator approval before it will be visible.

    Guest
    Add a comment...

    ×   Pasted as rich text.   Paste as plain text instead

      Only 75 emoji are allowed.

    ×   Your link has been automatically embedded.   Display as a link instead

    ×   Your previous content has been restored.   Clear editor

    ×   You cannot paste images directly. Upload or insert images from URL.

    Loading...

×
×
  • Create New...