
Assessing the Starting Pitching in the Twins' Organization
Entry posted by Thrylos ·
465 views
Twins Video
(originally published at The Tenth Inning Stretch)
---
For a baseball team to content, one of three things need to happen:
- An organization has to develop impact starting pitchers.
- An organization has to trade for impact starting pitcher.
- An organizations has to sign impact starting pitcher free agents.
I demonstrated earlier this month that the Twins' last two year abysmal record could have been predicted as earlier as 2008, based on the state of their starting pitching prospects. Only 11 pitchers who have been in the Twins' minors in 2008 are still in the organization and none has been an impact starter. The Twins have been adverse in doing numbers 2 and 3 above, so in order to compete, they have to develop starting pitching talent.
The Denard Span and Ben Revere trades infused the Twins with 3 young starting pitchers: Vince Worley, 24, and Trevor May and Alex Meyer, both 22, which makes the future a bit more hopeful. How hopeful? I will try to quantify, so the rest of the discussion here will be metrics and numbers based. This will actually be somewhat of a logical continuation of this analysis, where in August last year, I tried to look positively into the 2012 Minnesota Twins pitching and draw conclusions based on potential. What I am doing here is looking at the whole organization Starting Pitching, under very similar metrics and see what the future might look like. This will include potential rankings of Twins' starters, but it is not a prospect list. They are based on their 2012 performance (and adjusted for age and playing level) and not their potential. Injured players, such as Wimmers and Salcedo will be higher on prospect lists that ranked here, because their numbers were awful.
The metrics I like to use to do this have been some simple things of my own device: Pitching Effectiveness or PE and Expected Pitching Effectiveness or xPE. I fiddled around with PE in 2008 and with xPE in 2009. Here is the reason I devised PE and here is the reason I optimized it to xPE. My main arguments were a. I felt like xFIP and FIP and DICE weigh too much things like home runs (which anyone who watched the home runs by Miquel Cabrera and Delmon Young against the Twins yesterday cannot deny that they are a matter of inches and ballpark and luck and fielding performance from being a long fly ball). Also these formulae are hard to memorize and I wanted something simple I can calculate looking at a stat sheet and also something that you can calculate using splits (e.g. how has Brian Duensing or Glen Perkins been as a starter vs as a reliever); you can find xFIP around, but not in a spit form. So in 2008 I devised PE, which simple takes account three things: Strikeouts, walks and hits. So a pitcher who strikes out more people, walks fewer and gives lesser hits is more likely to succeed than someone who doesn't. And all hits are counted equal because the difference between a single and a triple might be the difference of having Delmon Young or Ben Revere play Left Field or the difference between a fly ball out and a home run might be the difference of having Torii Hunter or Rich Becker playing Center Field. And I use WHIP, K/9 and K/BB to calculate PE (a simple PE= (K/9*K/BB)/WHIP). xPE further normalizes for BABIP (to league average .290) to account for "luck" with hits. And unlike FIP and ERA, these two measures go the opposite directions (higher is better) and have a large variation (0.x to 100+) to allow for granularity in comparisons vs. compressing performance from 0 to 10 or so. Over here, I show that xFIP and FIP correlate pretty well to the much more complex SIERA, which is way too complex to be able to calculate just with a cell phone calculate (which is my goal as far as metrics go.)
PE and xPE have been fine to show performance and expected performance. How about potential? This is the many million dollar question, because if someone is able to guess estimate future potential of a player in single A, he/she will be having a great advantage in identifying cheap, future impact players, in a more objective way than scouting reports. So yet a new measure in the PE family has been devised: the adjusted expected pitching effectiveness or axPE. I tried something similar the off-season after the 2008 season, but the resulting formula was too complicated (cannot fit on a T-shirt or be calculated using a cell phone calculator), so needed to be refined. I hope I am close to this, since axPE is simpler. It takes into consideration level of play. Each level of play gets a number. Here are these numbers:
All Rookie Leagues: 1
A: 2
A+: 3
AA: 4
AAA: 5
MLB: 6
the average of the levels a player participated is taken into consideration for axPE. For example if a pitcher spent part of the season in high A and then moved to AA, the average level grade is 3.5.
The other adjustment involves someone's age. Younger players in higher levels have higher potential; this is the premise here. axPE is defined as xPE* (level/age) *7 . The 7 is a coefficient that makes it a number in the neighborhood of PE and xPE.
A note of importance: agPE is biased towards better performance in higher levels; this is by design, since there have been pitchers who blew away rookie leagues and then bottomed out when they went to AA.
The PE family metrics translators for starters (and relievers, for the sake of completeness, but RP are out of score here) are roughly translated to:
Rotation:
xPE/axPE
35+ Ace
25-35 #1- #2 Starter
15-25 #2- #3 Starter
10-15 #3 - #4 Starter
7.5-10 #5 Starter
Bullpen:
xPE/axPE
35+ Closer
25-35 Closer-Setup
15-25 Setup- Long Relief
8-15 Long Relief-Mopup
where axPE denotes intermediate/long term potential.
So, do the Twins have any potentially impact starters in their organization, based on their 2012 performance?
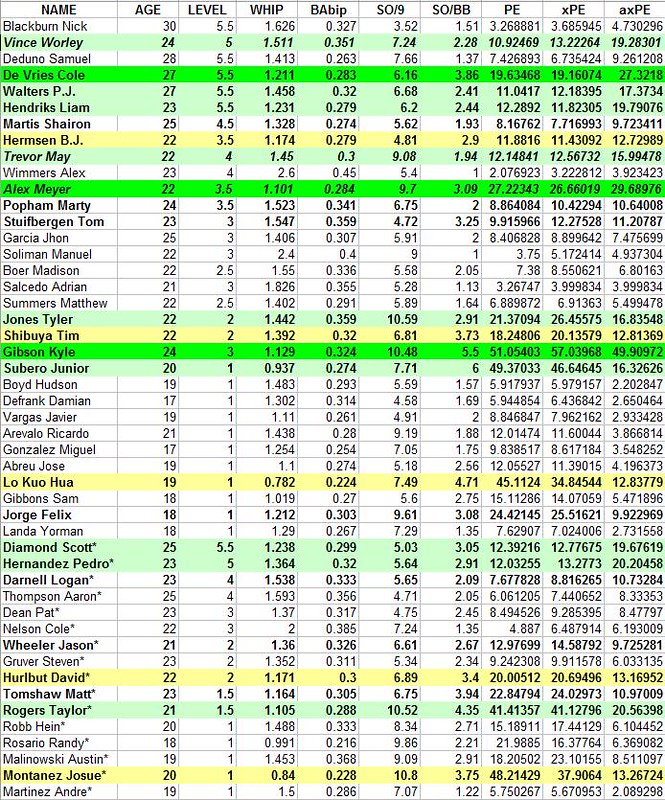
Without further ado, here are the numbers, that include pretty much every pitcher in the Twins organization, including the new ones, and those who pitched only in the major league level in 2012, under 30 years old. The age indicated is their age in 2012. I am including Nick Blackburn, for comparison's sake. Raw data is taken from B-R and an (*) denotes LHP:
Thus, it looks like the Twins have 3 potential impact starters in their organization; Kyle Gibson and Alex Meyer are not a surprise. Cole DeVries is. Cole DeVries' axPE is higher than his xPE level (which turns out to suggest a middle of the rotation starter), because he performed at the MLB level. Whether or not potential is applicable to a 28 year old who has reached the majors, is a good discussion. On the other extreme, some of the K/9 leaders in the organization, Josue Montanez, Taylor Rogers, Felix Jorge, Tyler Jones have repressed axPE, because they are still at the lower levels of the organization. I think that they need to prove themselves at higher level.
Based on this, and if you cut the list at 25 years old or younger, the Twins have at least couple of pitchers who have impact starter (i.e. top of the rotation/ace) potential and several who have mid-rotation potential.
A huge qualifier: This list is of pitchers who were used mostly as starters (i.e. made more starts than relief appearances in 2012.) This leaves at least one particular pitcher out who should be included, but he made 4 starts and 7 relief appearances: Jose Berrios. His numbers (albeit in 11 games and 30 some innings) are out of this world: 284.12 PE, 236.11 xPE, and 91.82 axPE. He should be part of the discussion and definitely has top of the rotation potential, but there is an asterisk for the reasons mentioned.
Others who made few starts but mostly used in a relief role but definitely should be part of the equation are (in no order) : Matt Houser, Miguel Munoz, AJ Achter, Cole Johnson, Argentis Silva (the 16 year old high bonus singing) Elias Villasarra, Fernando Romero, Luke Bard, Jose Jimenez, Corey Kimes, Brett Lee and Mason Melotakis.


9 Comments
Recommended Comments